The final results for 542 constituencies have just been declared. Elections to one constituency – Vellore in Tamil Nadu, were postponed. BJP with 303 seats has retained its position as the single largest party. In this document, we analyse the profile of the newly elected Members of Parliament of the 17th Lok Sabha.
BJP has the highest representation
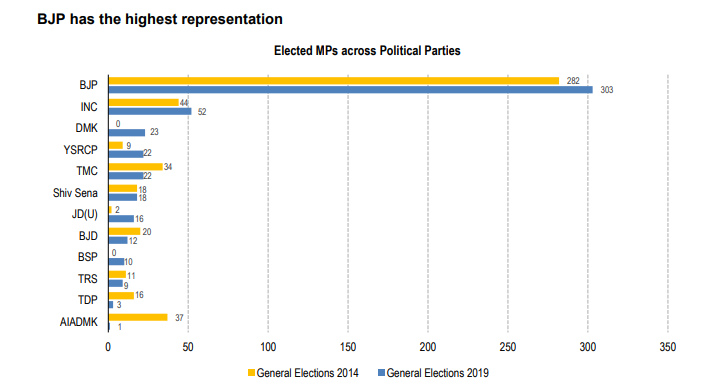
397 MPs were elected from national parties. Of these 303 MPs were from BJP, 52 from Congress, and 22 from
TMC.
Among the state parties DMK (23) and YSRCP (22) won the most seats.
267 first-term MPs in the 17th Lok Sabha*
*267 MPs will be in Lok Sabha 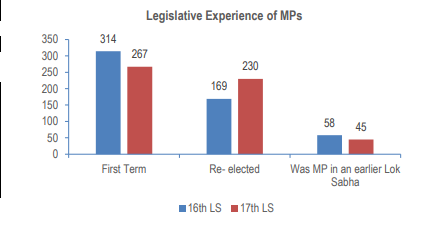
for their first –term. From the
outgoing Lok Sabha, 230 MPs
were re-elected. Further, 45 have
been members of earlier Lok
Sabhas.
The number of MPs re-elected is
significantly higher than in the last
general election..*
Fewer MPs over 70 years, more MPs under 40 years
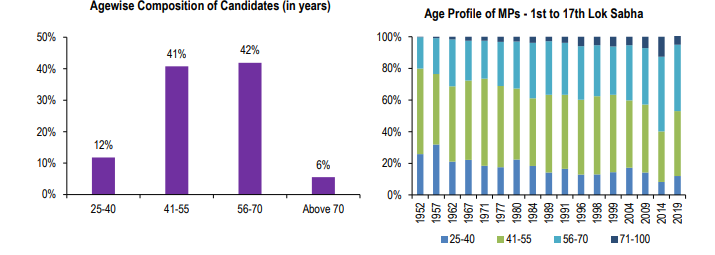
The average age of an MP is 54 years.
The 17th Lok Sabha has 12% of MPs below the age 40 years. This is more than that of the 16th Lok Sabha which
had 8% of MPs below the age of 40 years.
This bucks the longer term trend of Lok Sabha getting older. The proportion of MPs below 40 years of age has
steadily declined from 26% in the first Lok Sabha.
On average, women MPs are 6 years younger compared to male MPs in the 17th Lok Sabha.
394 MPs have at least Graduate level education
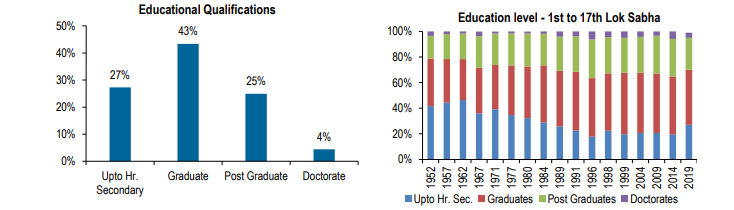
In the 17th Lok Sabha, 27% of MPs have studied till 12th class. In comparison, 16th Lok Sabha had 20% MPs who
had studied till 12th class.
Since 1996, at least 75% of representatives of each Lok Sabha have been graduates.
78 women MPs in the 17th Lok Sabha

716 women candidates contested the General Election. Out of which, 78 women MPs have been elected to the 17th
Lok Sabha. In 2014, 62 women MPs were elected.
The representation of women MPs in Lok Sabha is slowly improving from 5% in the 1st Lok Sabha to 14 % in the 17th
Lok Sabha.
Though the percentage of women MPs has increased over the years, it is still lower in comparison to some countries.
These include Rwanda (61%), South Africa (43%), UK (32%), USA (24%), Bangladesh (21%).
Most MPs have declared political and social work as their occupation
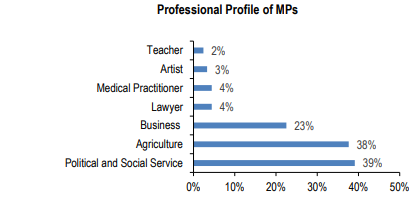
39% of MPs have listed their
occupation as political and social work.
38% are engaged in agricultural
activities. 23% MPs are businessmen.
Only 4% of MPs are lawyers.
Note: Several MPs have declared more
than one occupation.
Source: The list of MPs is based on information from the Election Commission of India (results.eci.gov.in). The data on the newly elected MPs have been taken from candidate affidavits collated by Association of Democratic Reforms (ADR), Data on other Parliaments is from Inter-Parliamentary Union (http://www.ipu.org/wmne/classif.htm) as on May 24, 2019. Other data is from the publications and website of
Lok Sabha.
This data has been published with permission from PRS Legislative Research (PRS). The opinions expressed herein are entirely those of the author(s). PRS is an independent, not-for-profit group.